VRS X Coolest Functions
Few words about what makes VRS X amazing
VRS X METAR Decoder
Weather Integration: The METAR Decoder
VRS X features a high-precision, state-of-art METAR decoder. It doesn't just display raw weather strings; it parses real-time data from NOAA (National Oceanic and Atmospheric Administration) to provide structured, actionable weather information directly on your radar.
Why it's different?
Most radar systems just "show" the METAR. VRS X understands it. The internal engine decodes wind vectors, pressure settings, cloud layers, and visibility to provide a clear overview of flight conditions (VFR/IFR/LIFR) at a glance.
This feature is enabled by default to ensure you always have the most accurate environmental data available.
Configuration
To make it working, please make sure Airport Database is created. To do, please refer to the article below:
Additional data: Airport Database.
On-Map Visualization
Once airports are imported, weather data is seamlessly integrated into the map experience
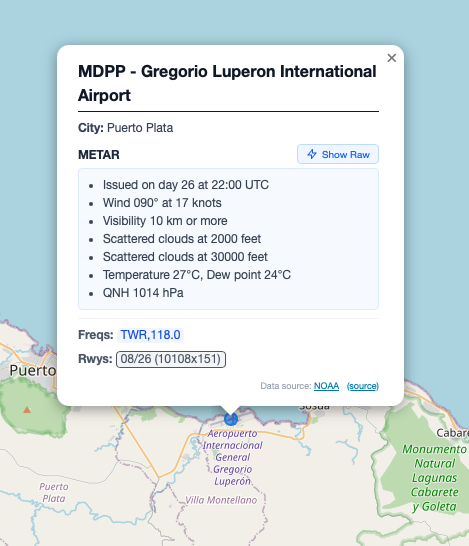
Decoded Data Includes:
-
Wind: Direction and speed (including gusts).
-
Visibility: Reported in statute miles or meters.
-
Sky Condition: Cloud layers (Few, Scattered, Broken, Overcast) and altitudes.
-
Temperature & Dew Point: Precise Celsius readings.
-
Altimeter (QNH): Critical pressure data for altitude calibration.
State-of-art decoding: The "Raw" vs "Decoded"
VRS X always keeps the raw METAR string for reference at the bottom of the weather card, but the UI highlights the parsed values. This ensures that even the most complex strings (including remarks/RMK) are handled with engineering-grade accuracy.
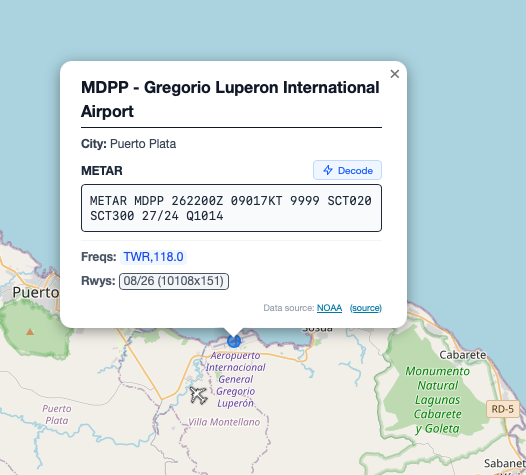
💡 Developer's Tip: The weather engine relies on the Airport Database (OurAirports). Ensure you have imported airports first, as VRS X uses ICAO codes to match weather reports to their geographical locations.
VRS X Smart Map Clustering
VRS X Smart Map Clustering
Radar-scale traffic without melting the browser
VRS X can handle very busy airspace without turning the map into an unreadable pile of markers. When you zoom out, the radar switches from individual aircraft to intelligent map clustering, keeping the map fast, readable, and useful even with thousands of live aircraft.
This is especially important for large merged feeds, public radar views, and mobile clients where drawing every aircraft at world or continent scale would waste CPU and make the UI feel frozen.
Why it is different
A normal aircraft map has a simple problem: the farther you zoom out, the more aircraft compete for the same screen space.
VRS X solves this by changing the visualization mode with zoom level:
- At low zoom levels, aircraft are grouped into stable grid clusters.
- The cluster count shows traffic density without covering the whole map with overlapping icons.
- At closer zoom levels, individual aircraft return with their normal markers, labels, tracks, colors, and details.
- Selected aircraft and high-priority objects can still stay visible where it matters.
The result is a map that remains responsive at global scale and still becomes detailed when you zoom into a region, airport, or approach corridor.
Why operators like it
Smart clustering makes VRS X useful as both a radar and an operations overview:
- You can see where traffic is concentrated without losing the whole map.
- You can quickly spot feed coverage areas and dense regions.
- You avoid huge marker overlap at continent scale.
- Mobile clients remain much more stable under heavy traffic.
- Large merged feeds stay practical instead of becoming a browser stress test.
Grid clustering and coverage awareness
The current low-zoom grid style is not only a performance trick. It also gives a quick visual sense of where your network is active. Dense cells show where aircraft are currently being received, while sparse or empty regions can hint at traffic gaps, disabled feeds, or missing coverage.
For deeper historical coverage analysis, use the dedicated Coverage page in the Operator's Handbook.
The practical win
With smart clustering enabled, VRS X can keep the radar readable while processing heavy real-world traffic. You can start wide, understand the big picture, and then zoom in only where individual aircraft matter.
That is the point: overview first, detail on demand.
Viewport-Aware AircraftList.json
Viewport-Aware AircraftList.json
The radar only asks for what the screen can use
VRS X does not treat AircraftList.json as a blind "send every aircraft every time" endpoint. The radar frontend sends the current map viewport to the backend, and the backend shapes the response around that exact view.
That means a world view, a Europe view, and a close zoom over Frankfurt do not have to cost the browser the same amount of work.
What the frontend sends
The map reports its current bounds and zoom, then useAircraftList includes them in every AircraftList.json request:
fNBnd- north latitude bound,fSBnd- south latitude bound,fEBnd- east longitude bound,fWBnd- west longitude bound,zoom- current map zoom,vwandvh- viewport width and height,selected- selected aircraft id, when one is pinned,maxItems- render budget derived from zoom,renderMode=cluster- tells the backend to return clusters when needed.
The current radar poll interval is one second, but each poll is viewport-aware instead of globally naive.
Zoom-aware render budget
The frontend asks for smaller render budgets when the map is zoomed out:
- zoom
<= 2-> about70drawn objects, - zoom
<= 4-> about100drawn objects, - zoom
<= 5-> about140drawn objects, - zoom
<= 6-> about260drawn objects, - closer zooms -> about
1200drawn objects.
The backend also clamps requested budgets and applies its own low-zoom caps before deciding whether it can return individual aircraft directly or should return clusters.
What the counters mean
A status line such as:
12 Shown / 4557 Visible / 4948 Total · 70 Drawn
is the feature in action.
Totalis the full aircraft snapshot currently known by the server.Visibleis the aircraft count relevant to the current map viewport after bbox filtering.Shownis the number of individual aircraft markers returned inacList.Drawnis the actual number of map objects rendered: individual aircraft plus cluster objects.
So the radar can honestly report almost five thousand tracked aircraft and more than four thousand aircraft in the current viewport, while drawing only about seventy objects on the map. That is the whole point: preserve situational awareness without asking the browser to draw thousands of overlapping markers.
The left aircraft list stays complete
The map and the aircraft list use different data paths.
The map uses AircraftList.json with bbox, zoom and render budget. The left aircraft list uses /api/aircraft/sidebar, which is not limited by the map bounding box. It supports search, sorting and paged loading, so the list remains a full aircraft list for the selected feed or filter even when the map is heavily clustered.
This means operators can keep a wide, efficient map view while still browsing or searching the complete aircraft list on the left.
What the backend does
AircraftController.GetAircraftList receives the viewport bounds and filters the aircraft snapshot before mapping it to JSON.
The backend:
- excludes aircraft outside the requested viewport,
- ignores aircraft without latitude/longitude when a viewport is active,
- keeps selected aircraft visible even if it would otherwise fall outside the current viewport result,
- handles anti-meridian bounds correctly, so crossing
180/-180does not break the map, - returns individual aircraft directly when the visible count fits the render budget,
- returns clusters when the visible count is too large,
- keeps selected aircraft and emergency squawks as priority objects.
Why this is cool
The response contains both global and viewport-level truth:
totalActells you how many aircraft exist in the full snapshot,visibleActells you how many aircraft are relevant to the current viewport,acListcontains the aircraft that should be drawn individually,clustersrepresent dense groups without forcing the browser to render every marker.
This is why the UI can say things like "Shown / Visible / Total" while still drawing far fewer map objects than the raw aircraft count.
The practical win
This design keeps VRS X responsive with large feeds because filtering and clustering happen before the browser receives the render workload. The client gets enough information to stay honest about traffic volume, but not so much that the map becomes a CPU benchmark.
It is one of the quiet features that makes the radar feel fast: the server understands the map, the map asks better questions, and the aircraft list remains useful even when the map is aggressively optimized.